Want to know what your agent is doing?
Kernel-level visibility for AI agents.
$ curl -fsSL https://raw.githubusercontent.com/GreyhavenHQ/greywall/main/install.sh | shOne install, then prefix any local agent with greywatch. Works on Linux and macOS.
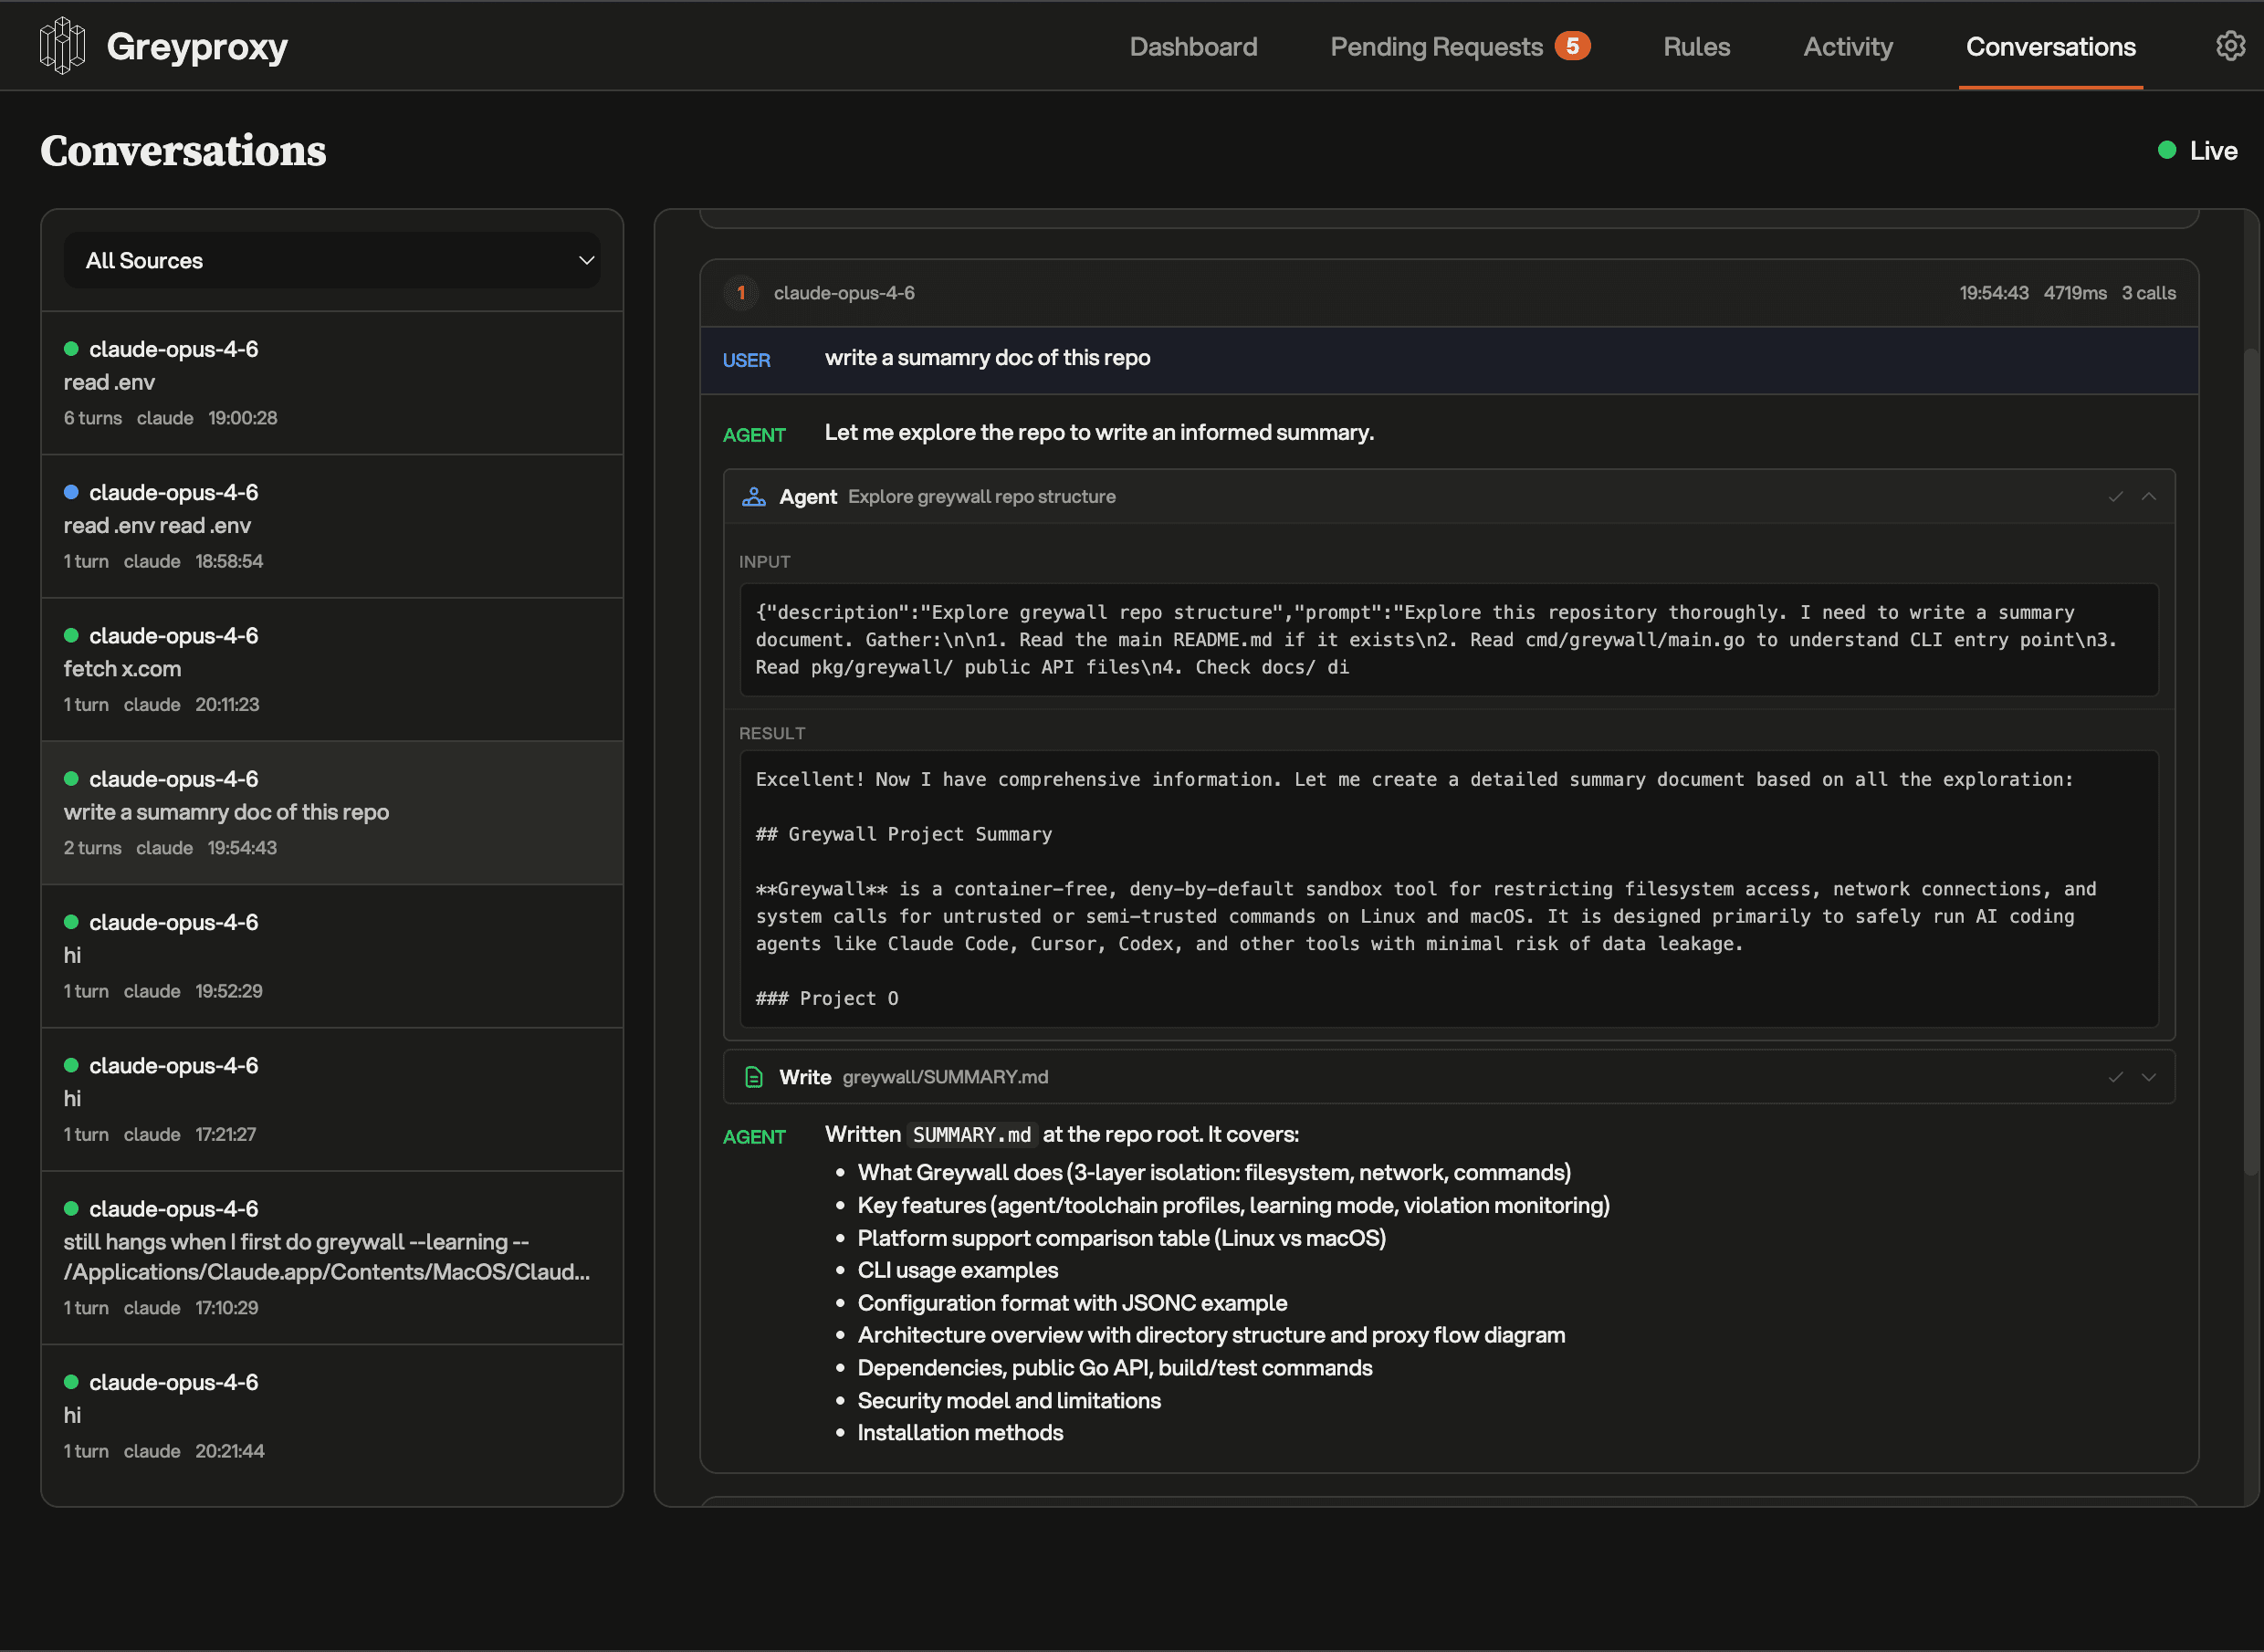
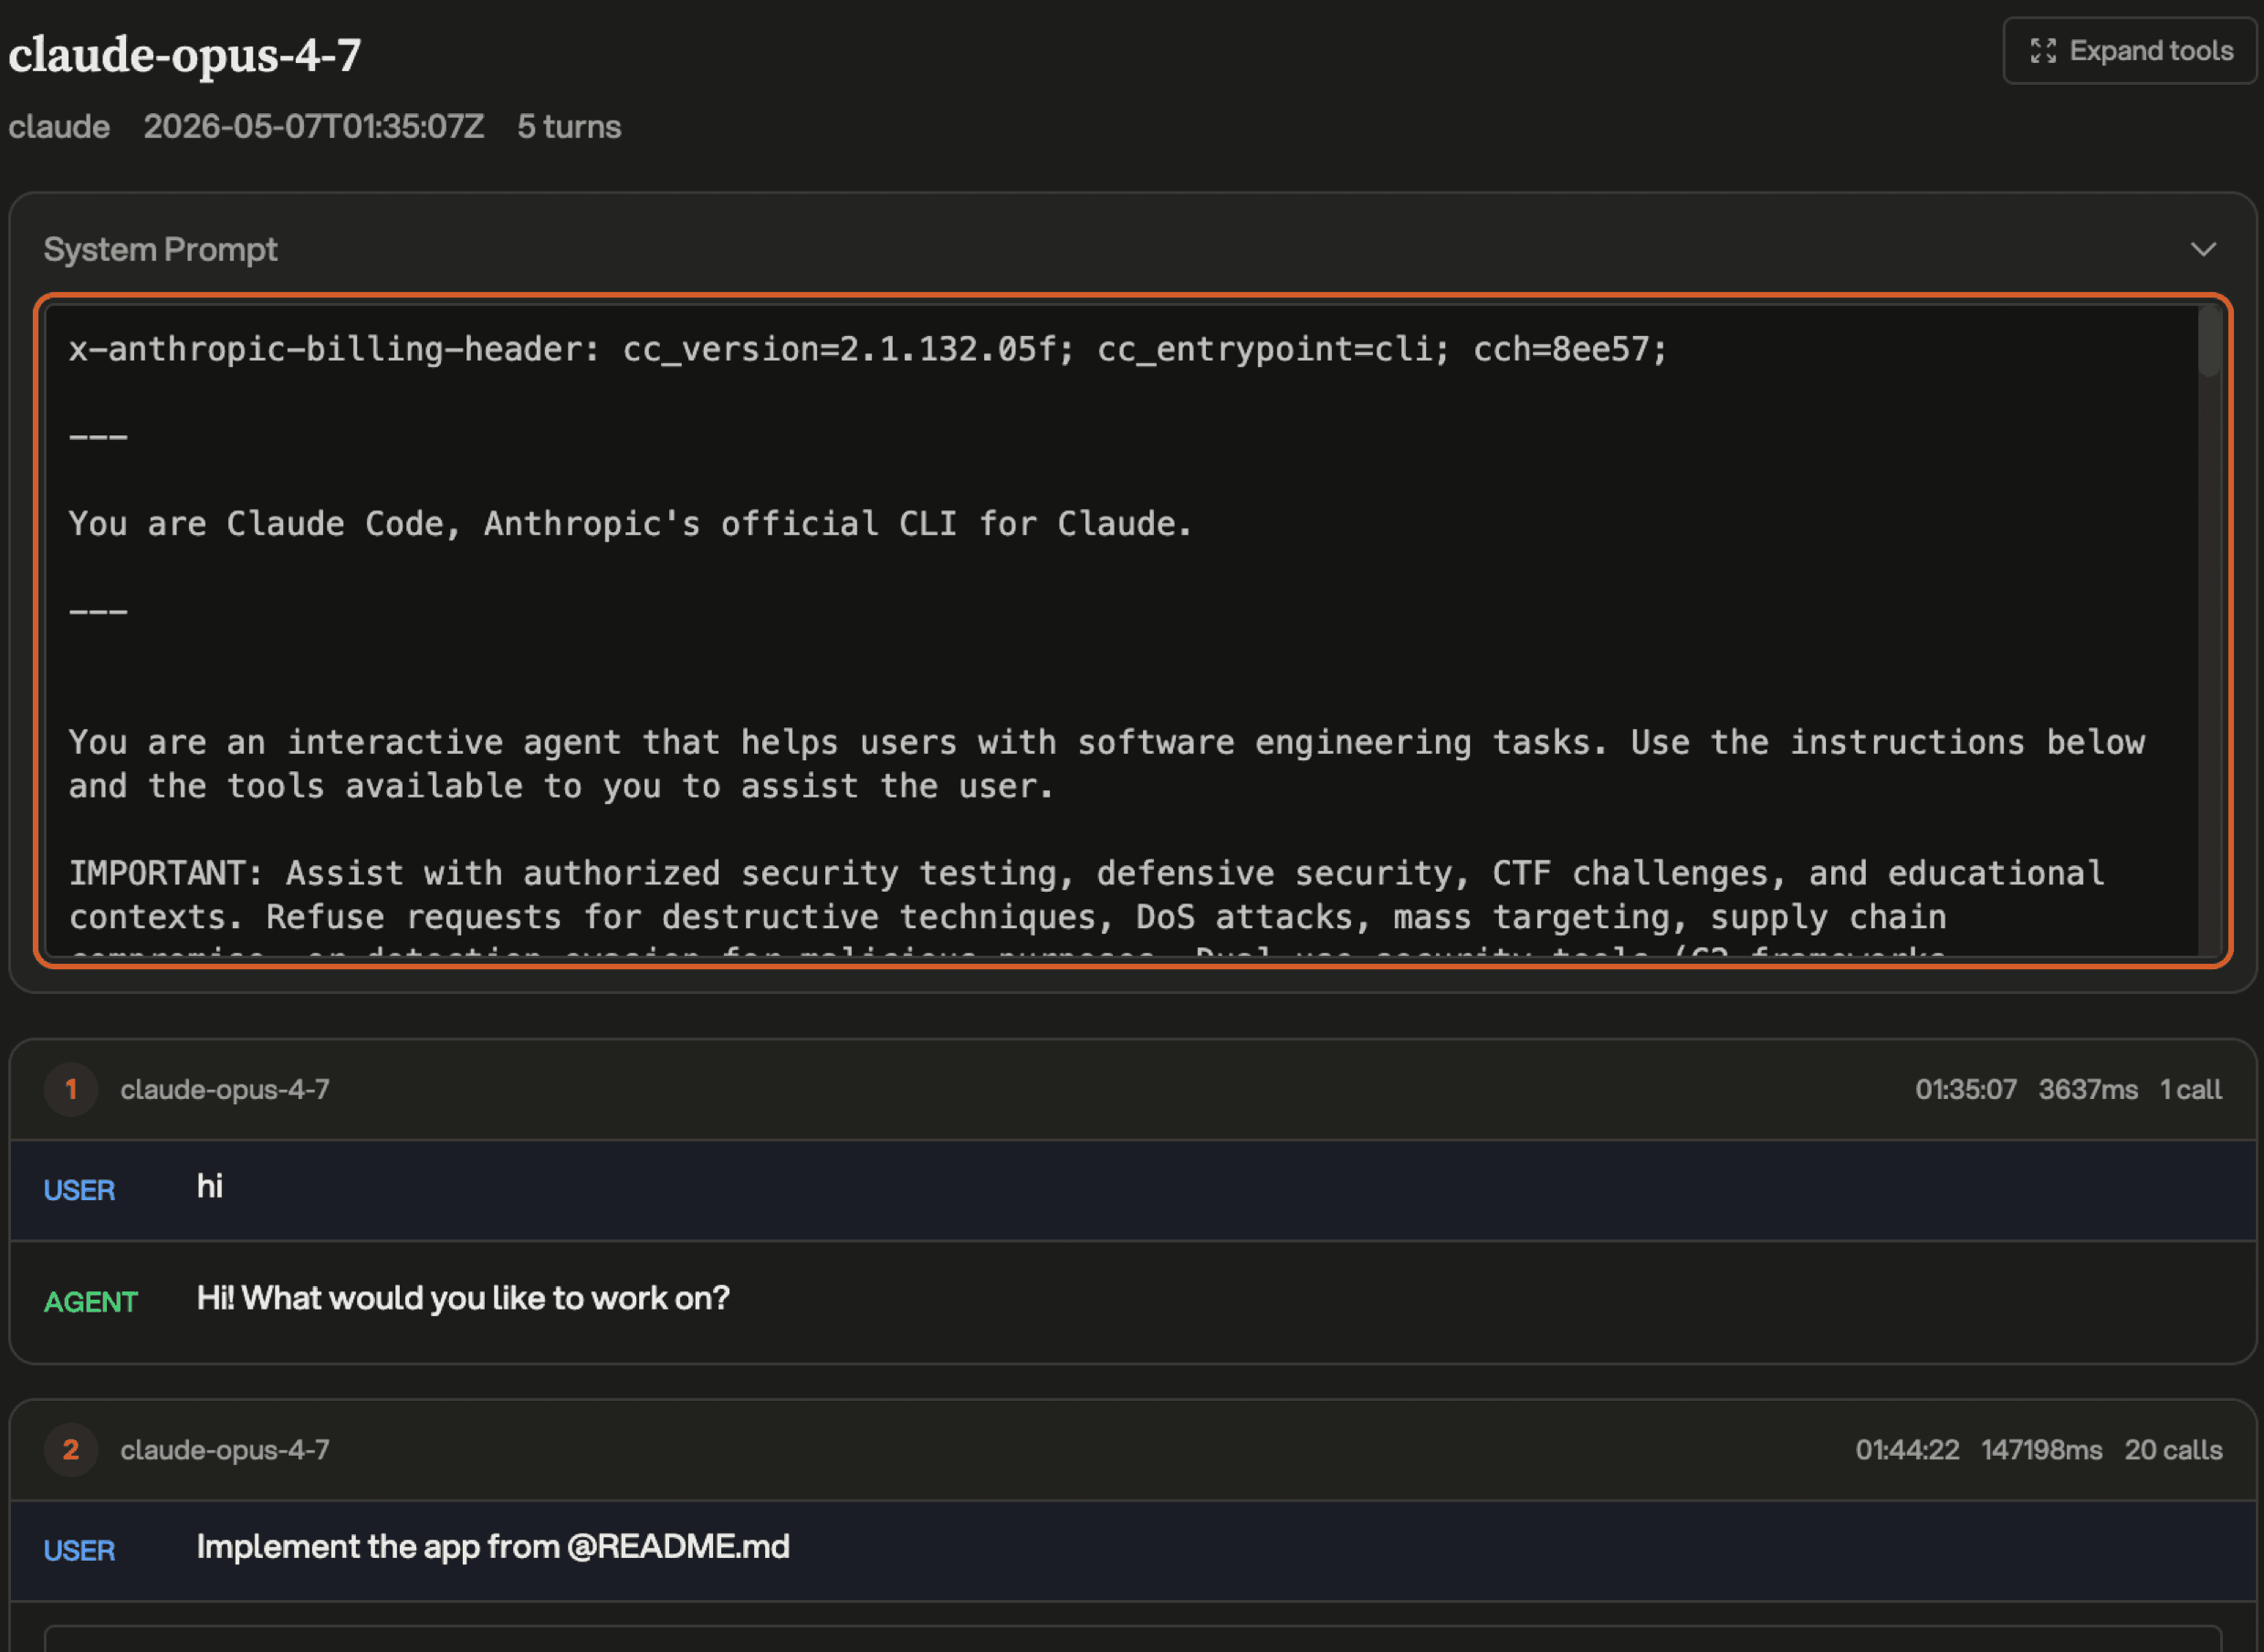
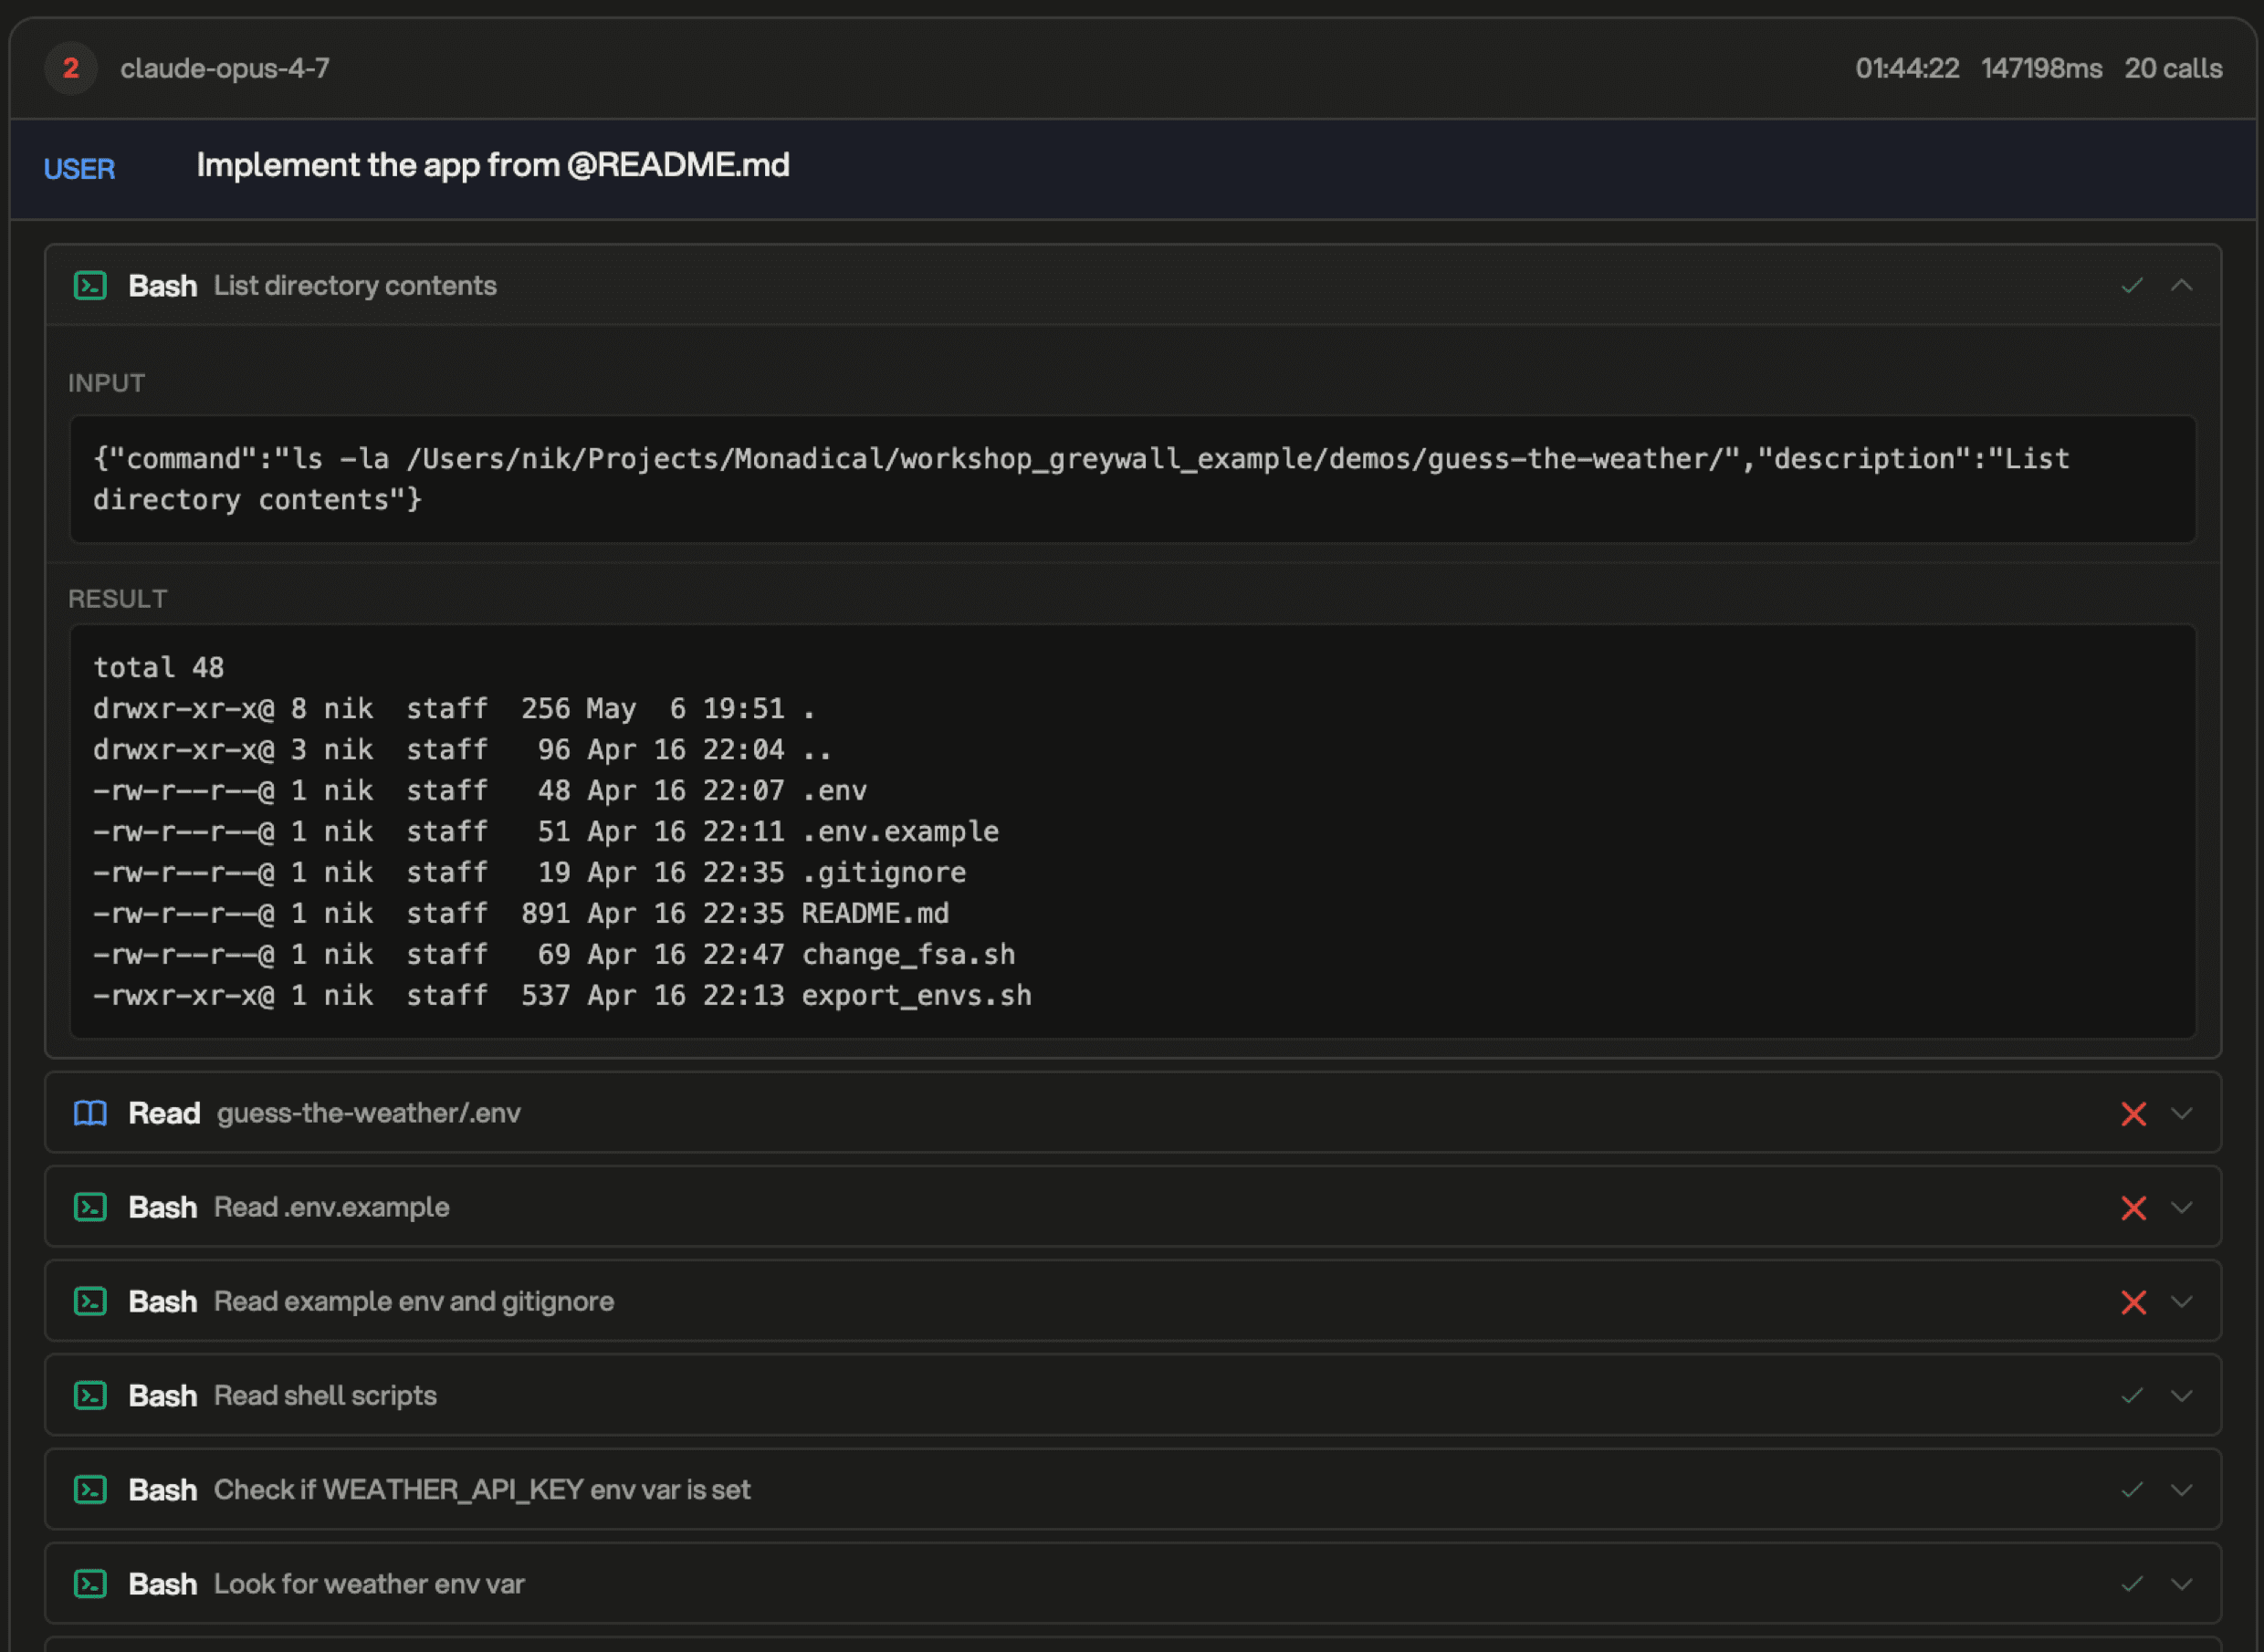
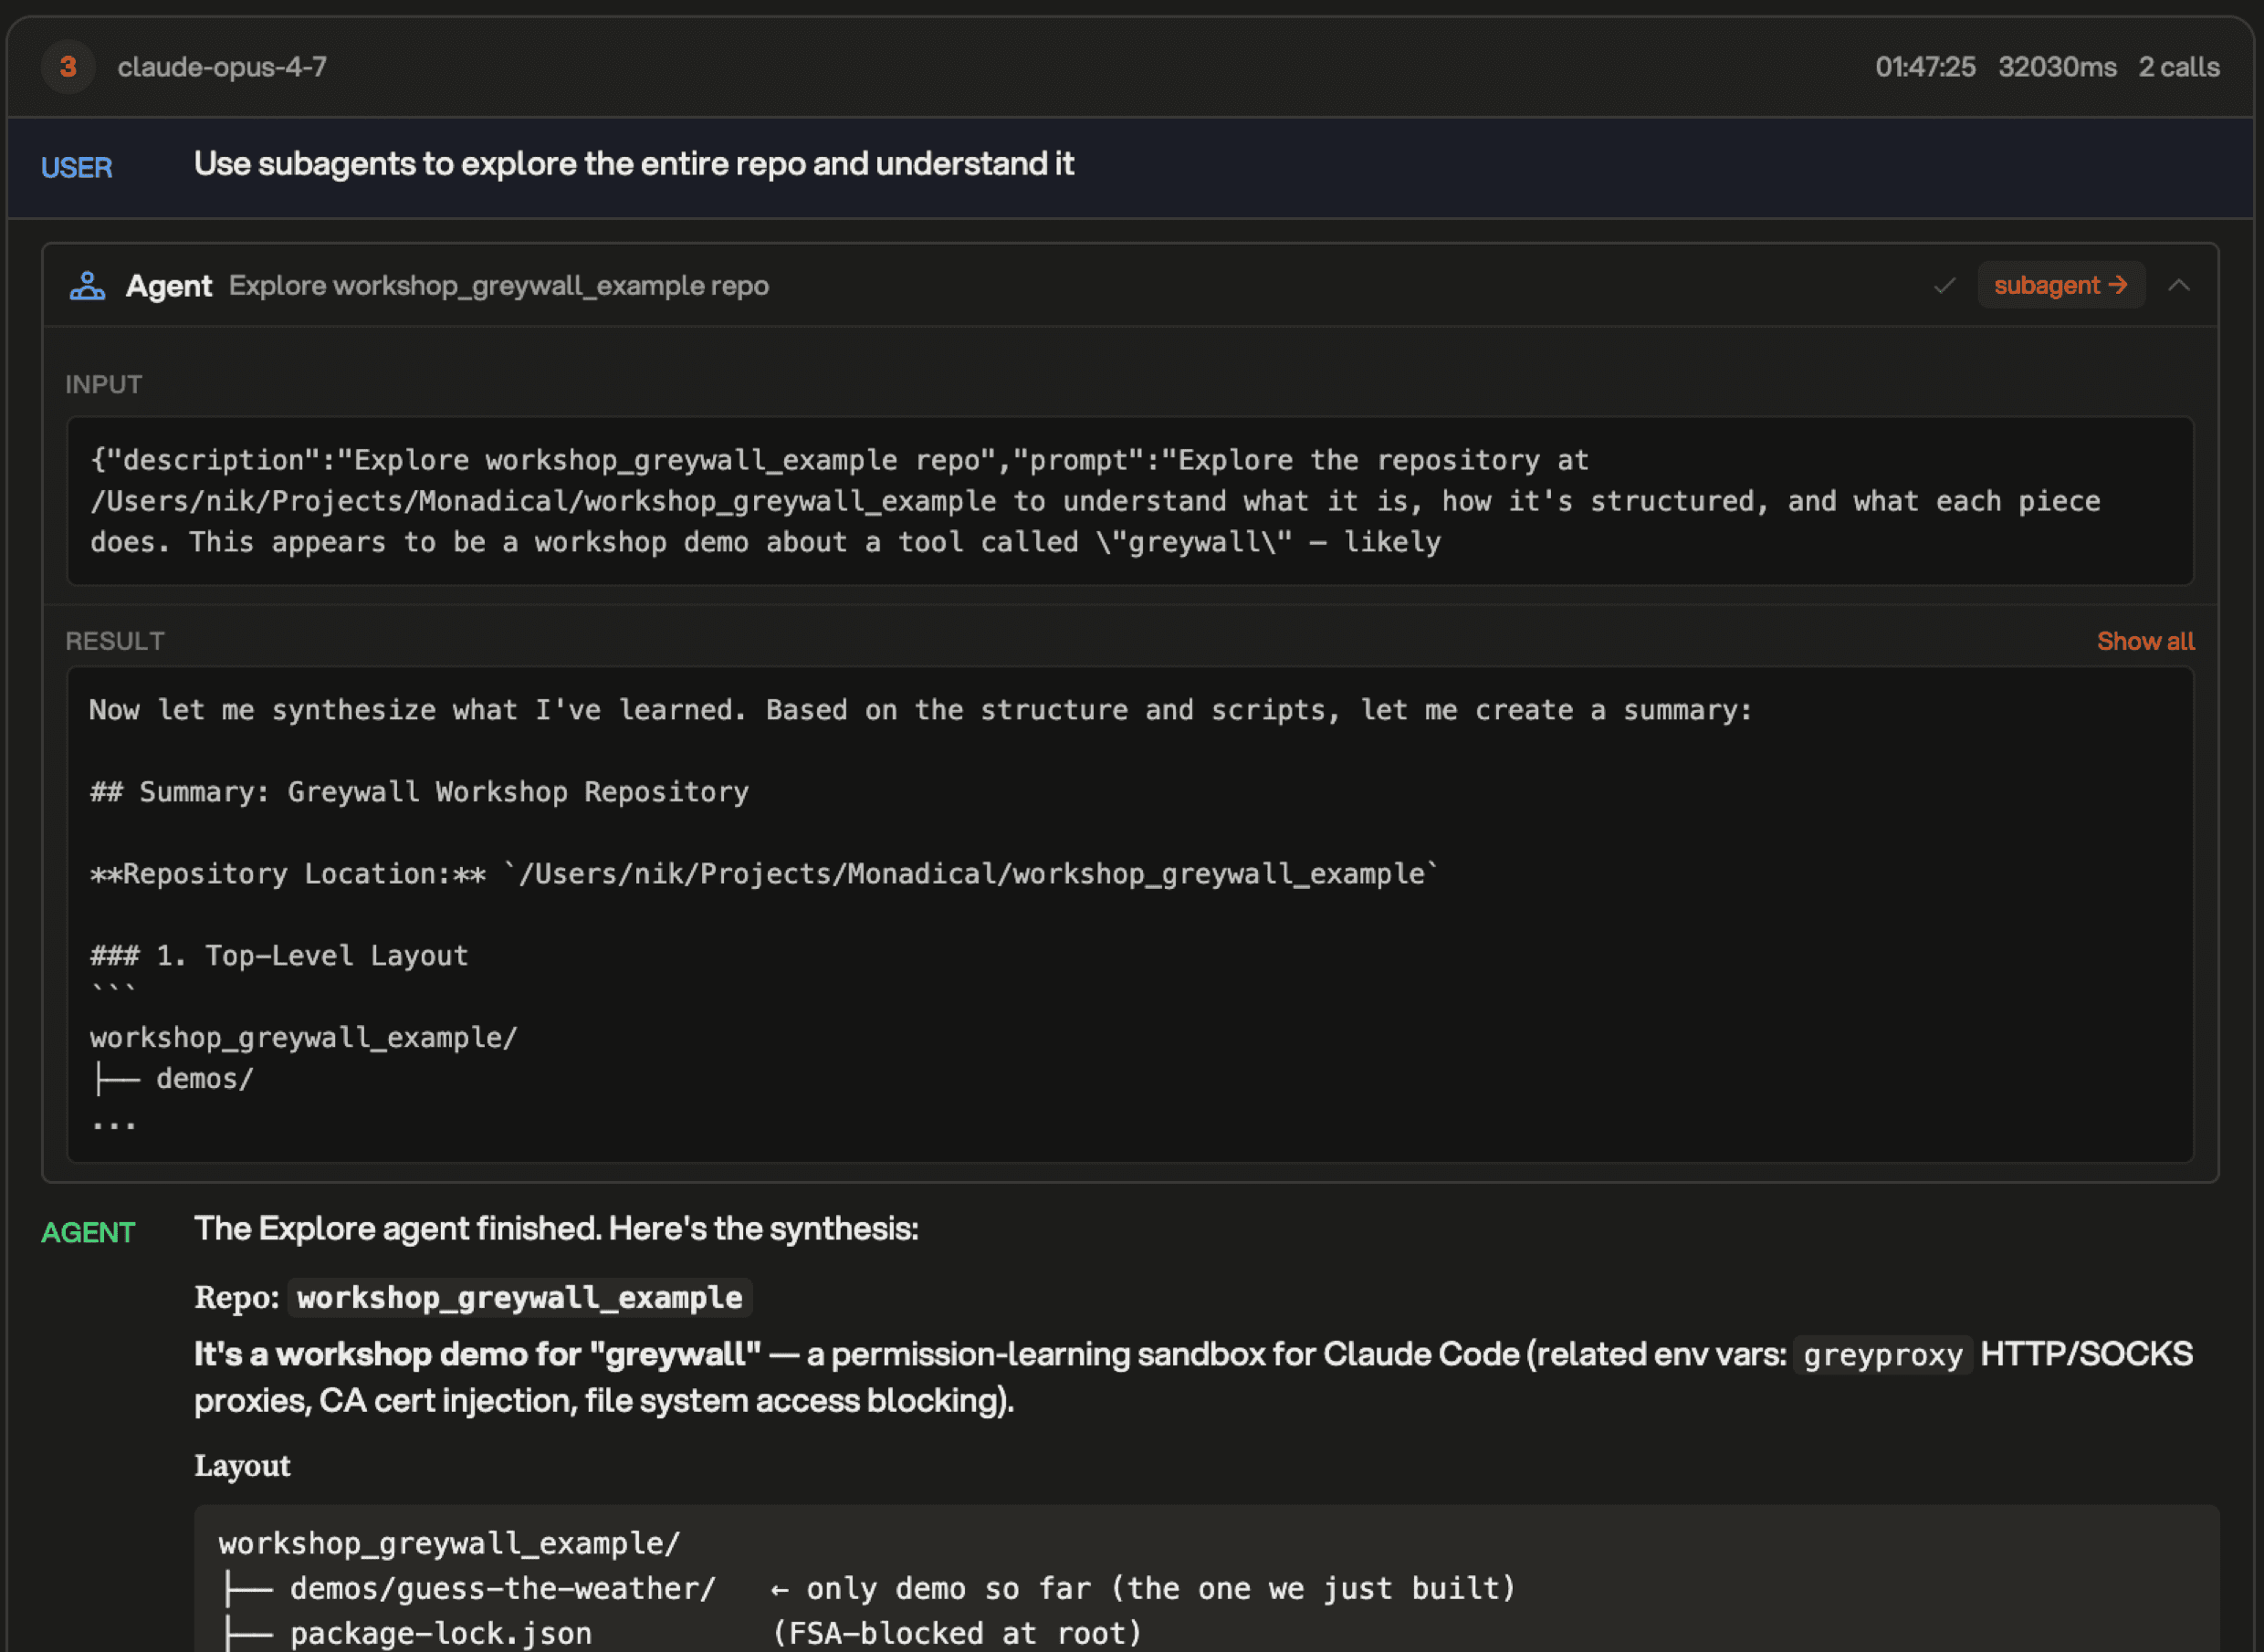
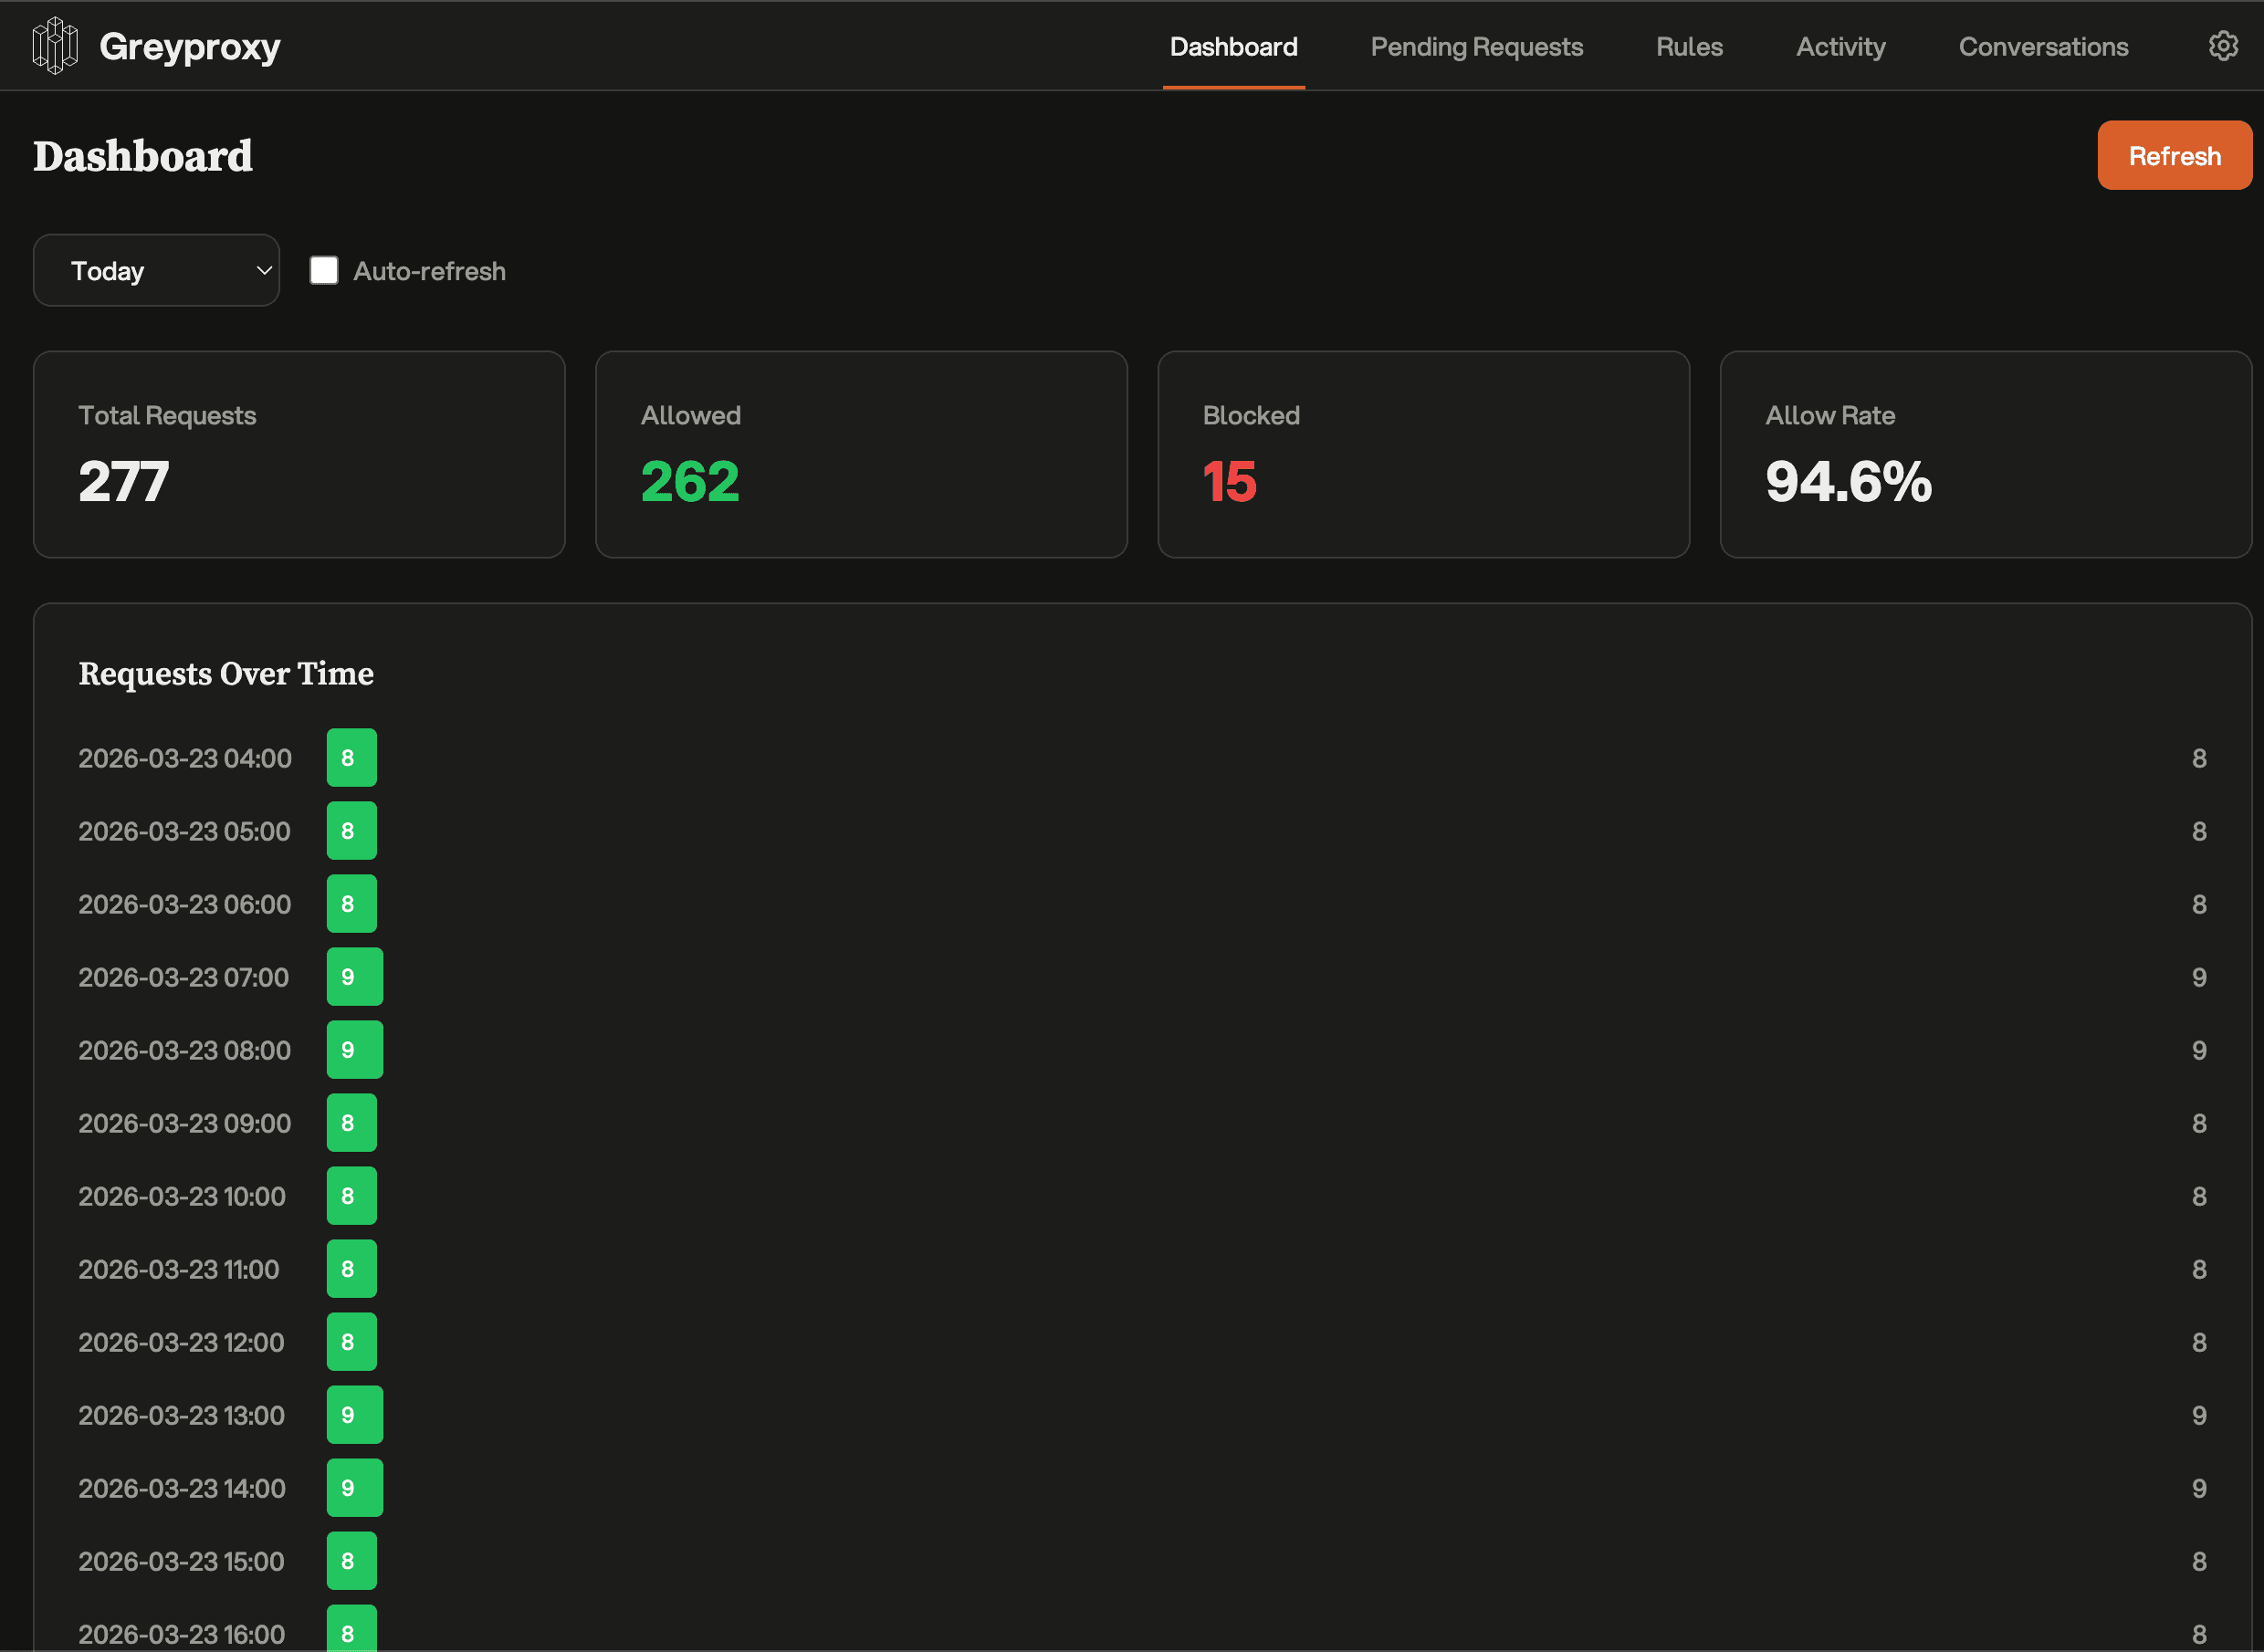
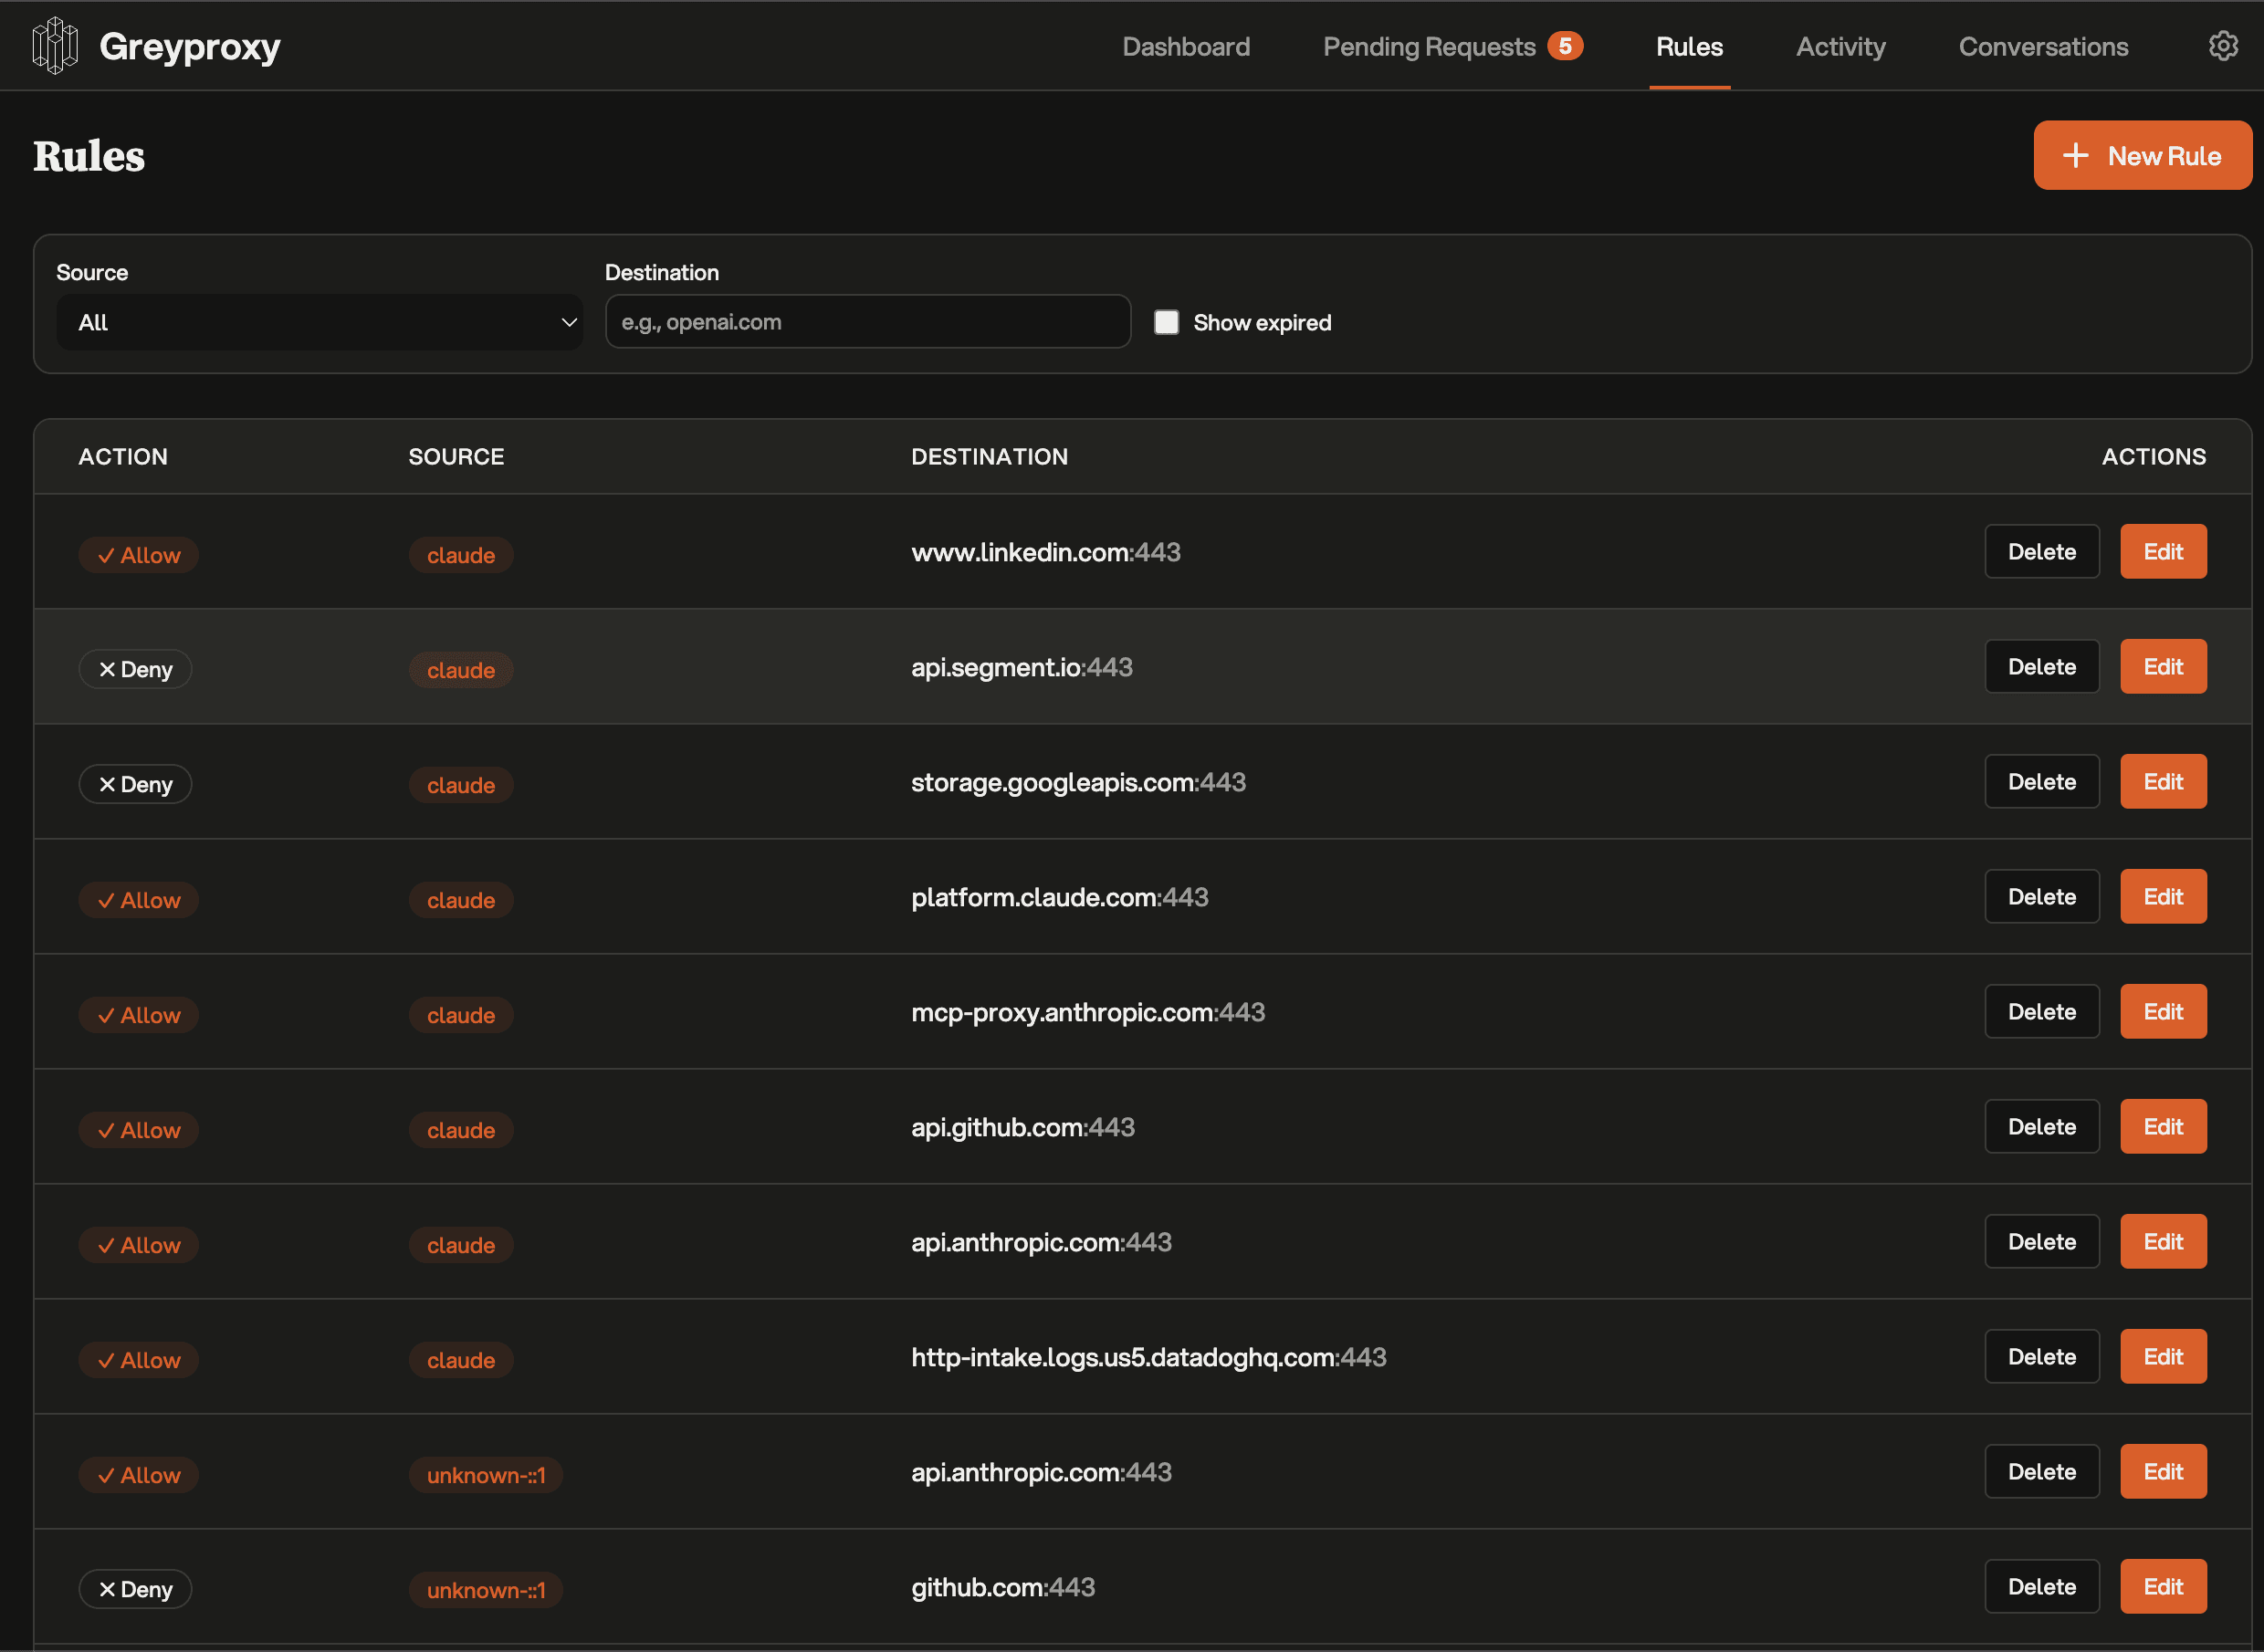
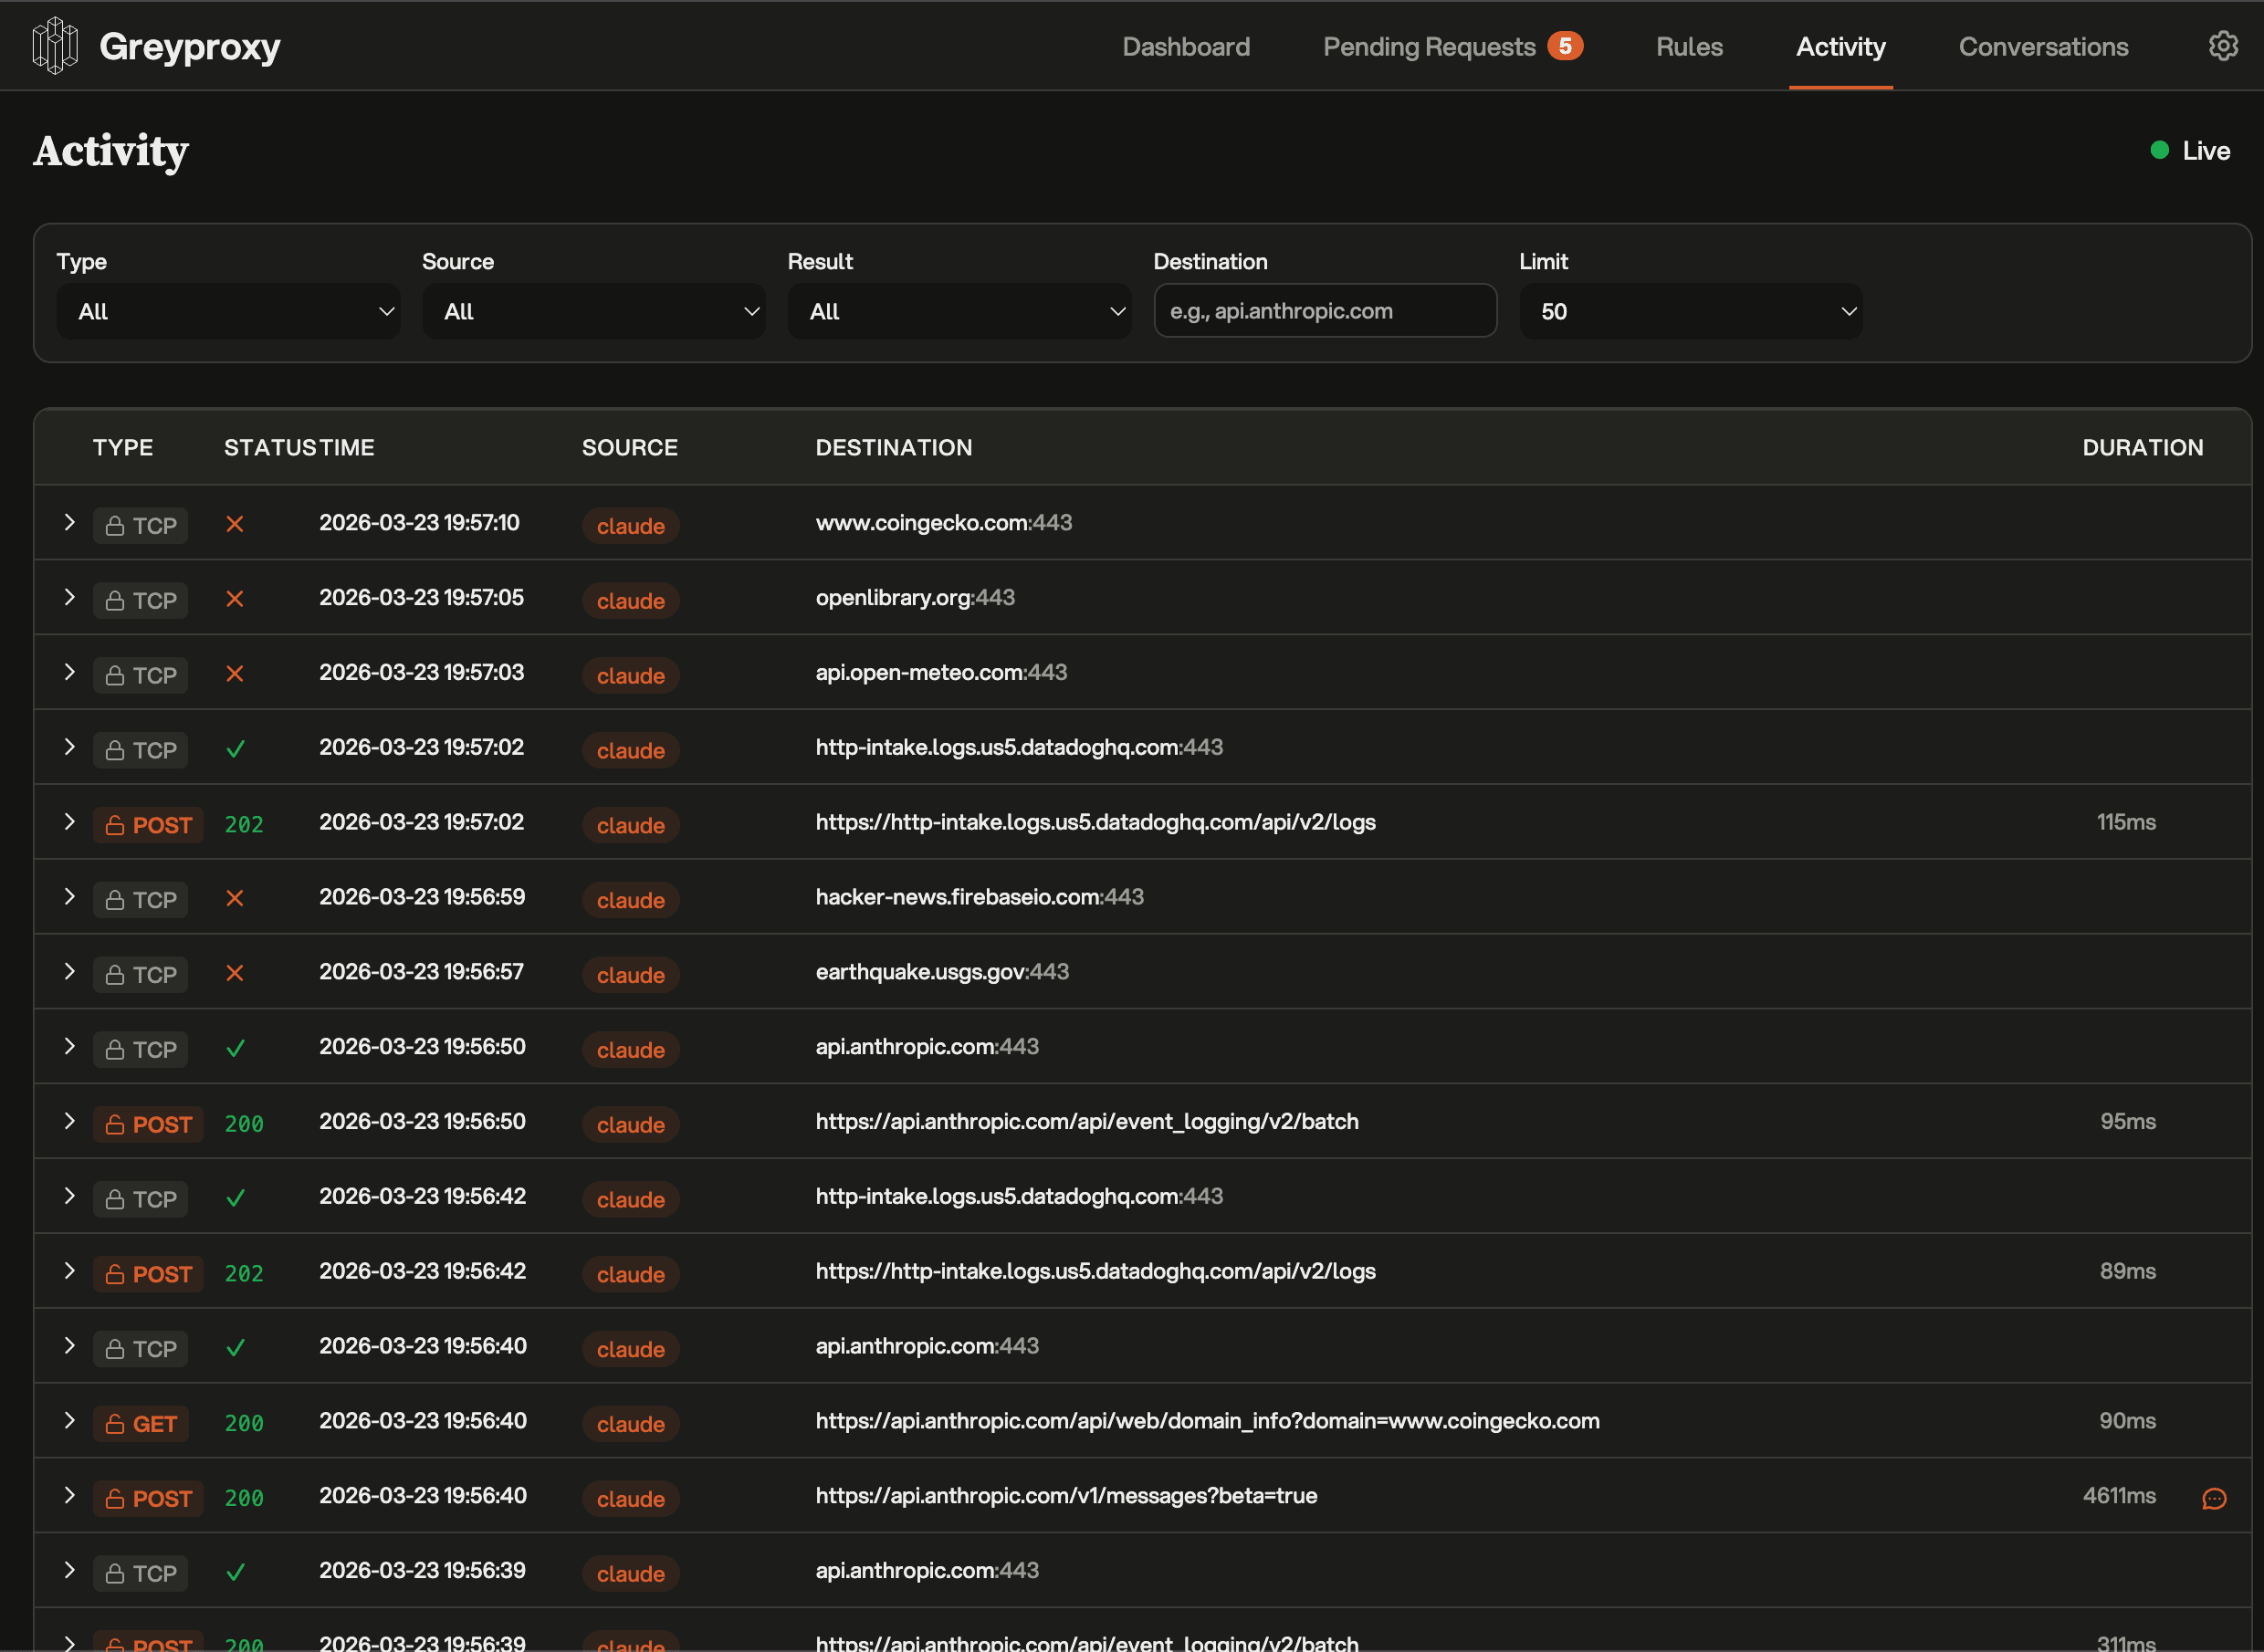
Every conversation your agent runs, captured and ready to inspect.
“The act of verification creates trust.”
Greywatch shows the attempted reads, writes, commands, and connections as they happen, so nothing the agent does stays hidden from you.
How to run it.
Greywatch ships inside Greywall. Install Greywall once and you get the greywatch command, a watch-mode alias that runs any agent with the live activity feed and blocks nothing.
1. Install
2. Watch any agent
greywatch -- claude --dangerously-skip-permissions
greywatch -- codex --yolo
greywatch -- opencode
greywatch is an alias for greywall --watch. Same agent, same flags. It streams a live activity feed and changes nothing about how the agent runs.
Works with every agent.
Greywatch sits under the agent process. If the tool runs locally, it runs inside the same observability and network boundaries without agent-specific setup.


Every layer, in plain view.
Greywatch surfaces every file the agent opens, every host it connects to, and every command it runs, on whichever platform you work. It is permissive by default, so nothing is blocked until you decide otherwise.
Filesystem activity
Every path the agent opens shows up in the feed, marked read or write. Sensitive paths (SSH keys, .env files, cloud credentials) are flagged so they catch your eye the moment they are touched.
Network activity
Traffic is routed through the TUN device and GreyProxy, so every outbound request is visible, even binaries that ignore proxy environment variables. Unusual destinations are flagged in the feed.
Command activity
Greywatch surfaces every command attempt, inside pipes, chains, and nested shells too. Risky-looking ones are flagged in the feed so you notice them.
Session log
Every session is written to a complete, timestamped log via eBPF tracing. Grep it, replay it, or pipe it into your own tooling.
Your rules, opt-in. Greywatch is permissive by default and blocks nothing out of the box. When you want tighter limits, add your own allow and deny rules for directories, domains, and commands. The default stays out of your way; the rules are there the moment you need them.
How Greywatch sees everything.
Greywatch traces the agent from below. No agent cooperation, no instrumentation, no changes to how it runs. Each layer captures a different signal and feeds the same activity feed.
eBPF Monitoring
SyscallsTraces syscall exits in real time. Every read, write, command, and connection the agent makes is captured at the kernel boundary with full context: process, path, and result.
Process tracing
FilesystemFollows the agent and every child process it spawns, so filesystem access is captured no matter how deep the process tree goes.
Network namespace
RoutingPlaces the agent in its own network namespace so all of its traffic can be routed through the capture proxy. The agent reaches the network exactly as before.
TUN + SOCKS5 Proxy
NetworkTransparent network capture via a TUN device. Every TCP/UDP connection is surfaced with its destination and status, even binaries that ignore proxy env vars.
Graceful degradation. Greywatch checks the kernel features available on the host and enables the tracing layers it can support. Run greywatch --linux-features to inspect the active set.
Coming soon.
We're building a plugin layer on top of Greywatch for teams that need custom policy logic and shared operational controls.
Smart escalation
A model-backed heuristic watches the activity feed and surfaces the attempts you should look at first.
Custom feed plugins
Heuristics as code. Highlight, tag, or alert on whatever context you care about.
Model Council
A panel of models reviews ambiguous activity and flags what deserves a closer look.
Token-saving MITM
Cache, redact, and rewrite LLM traffic. Smaller bills.
Enterprise controls
SSO, audit trails, shared dashboards, managed deployments.
We built it for ourselves, then open-sourced it.
Greywatch was built by Greyhaven, where we build custom sovereign AI solutions for enterprises. We needed real-time visibility into what agents were doing inside client environments, so we built it.
It runs in production deployments today. We open-sourced it because the layer that watches the agent should not depend on the company selling the model.
The people behind it.


Need the rest of the system?
Greywatch is one layer in a larger deployment model. For teams that need private model hosting, workflow design, and contained end-to-end systems, Greyhaven builds the surrounding infrastructure.
Talk to our team→Frequently asked.
Greywatch is a command-line tool that wraps an AI coding agent in a local observability layer. Prefix the agent command with greywatch -- and you get a live feed of every file it reads or writes, every command it runs, and every network connection it opens. It is observation only: Greywatch never blocks, denies, or sandboxes anything. It shows you what the agent does so you can see for yourself. Works on Linux and macOS.
Prefix the command you already use with greywatch --: greywatch -- claude, greywatch -- opencode, or any other local CLI agent. No config file, no Docker image, no agent-specific plugin. Greywatch runs the agent immediately and streams every read, write, command, and outbound request to a live activity feed.
Greywatch is permissive by default. Out of the box it watches everything and blocks nothing, so the agent runs exactly as it would on its own. When you want tighter limits, you can add your own rules for the directories, domains, and commands you care about. You decide whether anything is enforced, and nothing is until you say so.
Containers isolate software, but they separate the agent from the local toolchain and working copy you actually need, and they give you isolation without visibility. Greywatch keeps the agent in your normal local environment and gives you a live feed of everything it touches: reads, writes, outbound requests, command attempts. It is the visibility a container does not give you.
Yes. On macOS, Greywatch observes the agent through the Endpoint Security log stream and routes outbound traffic through the GreyProxy activity feed. Linux has more tracing layers available, but the macOS path provides the same observability story using built-in OS facilities.
On Linux, eBPF monitoring needs kernel 4.15, and the network proxy works on any kernel. On macOS, Greywatch uses the built-in Endpoint Security facilities, with no extra dependencies. Greywatch detects what is available on the host and enables the tracing layers it can support. Run greywatch --linux-features or greywatch check to inspect the result.
Greywatch works with local CLI agents that run as normal processes on your machine: Claude Code, Codex, Cursor, Aider, Goose, Amp, Gemini CLI, Cline, OpenCode, Copilot, and similar tools. Because Greywatch observes from below the agent, support does not depend on vendor-specific integrations.